
In the dynamic world of trading, mastering chart patterns can significantly enhance your ability to recognize potential opportunities and execute profitable trades. This guide focuses on the Double Bottom pattern, a powerful tool in the trader’s arsenal, used to predict reversals from bearish to bullish trends. We’ll explore the intricacies of this pattern, offering practical tips and strategies to capitalize on this setup effectively.
Understanding the Double Bottom Pattern
The Double Bottom pattern, often resembling the letter «W», is a classic chart formation that signals a potential reversal of a prevailing downtrend into an uptrend. This pattern typically appears at the end of a bearish phase, indicating exhaustion in selling pressure and a possible shift towards buying momentum.
Formation and Characteristics
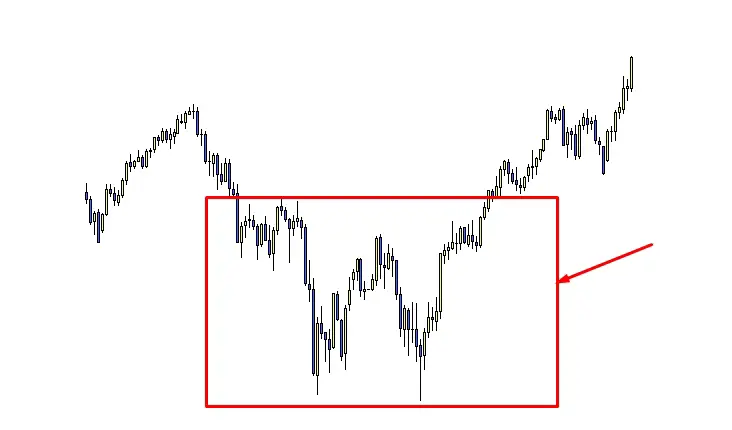
A Double Bottom pattern is characterized by two distinct troughs, approximately equal in depth, separated by a moderate peak. These troughs represent price levels where buying interest is strong enough to prevent further decline, setting the stage for a bullish reversal.
- First Trough: This forms when the price hits a low point, then rebounds as buyers enter the market, perceiving value at this level.
- Peak: After the rebound, the price faces resistance at a higher level and starts to retrace, leading to the formation of a peak that serves as the middle point of the W-shaped pattern.
- Second Trough: The price declines again to test the previous low, forming the second trough. It is crucial that this second low does not significantly surpass the first low; otherwise, it could indicate continued bearish sentiment rather than a reversal.
- Breakout: The completion of the second trough is followed by a breakout above the resistance level defined by the peak of the pattern. This breakout is typically accompanied by increased volume, validating the pattern and indicating a strong move upwards.
Volume Dynamics
Volume plays a critical role in confirming the Double Bottom pattern. Ideally, volume should increase on the rebound from the first and second troughs, with a noticeable spike during the breakout. This pattern of volume supports the authenticity of the reversal, as it shows that buyers are willing to step in aggressively.
Indicador KDJ ¿Qué es? ¿Cómo usarlo con la línea K?
Trading Strategies Based on the Double Bottom
Trading the Double Bottom involves several strategic considerations:
- Entry Point: A common strategy is to enter a long position after the price breaks above the resistance level (the peak). Traders often wait for the price to close above this level to confirm the breakout.
- Stop Loss: To manage risk effectively, a stop loss can be placed just below the second trough. This placement protects against the possibility that the pattern fails and the downtrend resumes.
- Profit Targets: The minimum profit target is typically set by projecting the distance from the resistance level to the lowest point of the pattern upwards from the breakout point.
Psychological Insights and Market Behavior
The Double Bottom pattern is not just a reflection of price movements but also of the psychology of market participants. The formation of the first trough indicates initial selling exhaustion, while the second trough confirms that bearish sentiment is waning, and bulls are starting to gain control.
Advanced Considerations
- False Breakouts: Traders must be cautious of false breakouts where the price momentarily breaches the resistance level but fails to sustain higher levels. It’s essential to look for confirmatory signs such as volume expansion or supporting technical indicators.
- Market Context: The reliability of the Double Bottom can vary based on market conditions and the asset traded. It’s important to consider overarching market trends and external factors that might influence price action.
- Complementary Indicators: Incorporating other technical tools like moving averages, RSI, or MACD can provide additional confirmation and enhance decision-making.
Conclusion
Mastering the Double Bottom chart pattern requires understanding its structure, recognizing its confirmation signals, and applying disciplined trading strategies. By integrating this knowledge with broader market analysis and sound risk management practices, traders can significantly enhance their trading efficacy.
Ordenador, tarjeta gráfica y monitores para una estación de trading
Descargo de responsabilidad
Toda la información contenida en este sitio web se publica solo con fines de información general y no como un consejo de inversión. Cualquier acción que el lector realice sobre la información que se encuentra en nuestro sitio web es estrictamente bajo su propio riesgo. Nuestra prioridad es brindar información de alta calidad. Nos tomamos nuestro tiempo para identificar, investigar y crear contenido educativo que sea útil para nuestros lectores. Para mantener este estándar y continuar creando contenido de buena calidad. Pero nuestros lectores pueden basarse en su propia investigación.